
Page 173 - JOURNAL OF LIBRARY SCIENCE IN CHINA 2015 Vol. 41
P. 173
172 Journal of Library Science in China, Vol. 7, 2015
preferences. As we mentioned in section 3.2, based on the expert judgments, we weighted
different information sources by their degree of enrichment and quality of information.
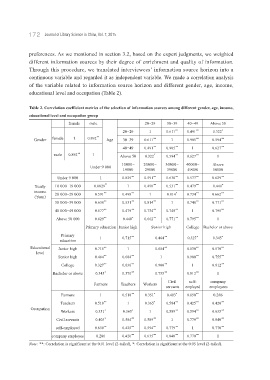
Through this procedure, we translated interviewees’ information source horizon into a
continuous variable and regarded it as independent variable. We made a correlation analysis
of the variable related to information source horizon and different gender, age, income,
educational level and occupation (Table 2).
Table 2. Correlation coefficient metrics of the selection of information sources among different gender, age, income,
educational level and occupation group
female male 20-29 30-39 40-49 Above 50
20-29 1 0.611 ∗∗∗∗ 0.491 ∗∗∗∗ 0.322 ∗
Gender female 1 0.892 ∗∗∗∗ Age 30-39 0.611 ∗∗∗∗ 1 0.905 ∗∗∗∗ 0.594 ∗∗∗∗
40-49 0.491 ∗∗∗∗ 0.905 ∗∗∗∗ 1 0.627 ∗∗∗∗
male 0.892 ∗∗∗∗ 1 Above 50 0.322 * 0.594 ∗∗∗∗ 0.627 ∗∗∗∗ 1
Under 9 000 10000- 20000- 30000- 40000- Above
19000 29000 39000 49000 50000
Under 9 000 1 0.829 ∗∗∗∗ 0.591 ∗∗∗∗ 0.638 ∗∗∗∗ 0.577 ∗∗∗∗ 0.629 ∗∗∗∗
Yearly 10 000-19 000 0.0829 ** 1 0.498 ∗∗∗∗ 0.531 ∗∗∗∗ 0.479 ∗∗∗∗ 0.440 ∗∗
income 20 000-29 000 0.591 ∗∗∗∗ 0.498 ∗∗∗∗ 1 0.814 ∗∗ 0.734 ∗∗∗ 0.662 ∗∗∗
(Yuan)
30 000-39 000 0.638 ∗∗∗∗ 0.531 ∗∗∗∗ 0.814 ∗∗∗∗ 1 0.748 ∗∗∗∗ 0.771 ∗∗∗∗
40 000-49 000 0.577 ∗∗∗∗ 0.479 ∗∗∗∗ 0.734 ∗∗∗∗ 0.748 ∗∗∗∗ 1 0.795 ∗∗∗∗
Above 50 000 0.629 ∗∗∗∗ 0.440 ∗∗ 0.662 ∗∗∗∗ 0.771 ∗∗∗∗ 0.795 ∗∗∗∗ 1
Primary education Junior high Senior high College Bachelor or above
Primary ∗∗∗∗ ∗∗∗∗ ∗ ∗
education 1 0.715 0.464 0.327 0.345
Educational Junior high 0.715 ∗∗∗∗ 1 0.684 ∗∗∗∗ 0.630 ∗∗∗∗ 0.570 ∗∗∗∗
level
Senior high 0.464 ∗∗∗∗ 0.684 ∗∗∗∗ 1 0.900 ∗∗∗∗ 0.755 ∗∗∗∗
College 0.327 ∗∗ 0.630 ∗∗∗∗ 0.900 ∗∗∗∗ 1 0.812 ∗∗∗∗
Bachelor or above 0.345 ∗ 0.570 ∗∗∗∗ 0.755 ∗∗∗∗ 0.812 ∗∗∗∗ 1
Civil self- company
Farmers Teachers Workers
servants employed employees
Farmers 1 0.518 ∗∗∗∗ 0.351 ∗ 0.403 ∗ 0.650 ∗∗∗∗ 0.286
Teachers 0.518 ∗∗∗∗ 1 0.365 ∗ 0.584 ∗∗∗∗ 0.425 ∗∗∗∗ 0.420 ∗∗∗∗
Occupation
Workers 0.351 ∗ 0.365 ∗ 1 0.589 ∗∗∗∗ 0.594 ∗∗∗∗ 0.635 ∗∗∗∗
Civil servants 0.403 ∗ 0.584 ∗∗∗∗ 0.589 ∗∗∗∗ 1 0.779 ∗∗∗∗ 0.840 ∗∗∗∗
self-employed 0.650 ∗∗∗∗ 0.425 ∗∗∗∗ 0.594 ∗∗∗∗ 0.779 ∗∗∗∗ 1 0.770 ∗∗∗∗
company employee 0.286 0.420 ∗∗∗∗ 0.635 ∗∗∗∗ 0.840 ∗∗∗∗ 0.770 ∗∗∗∗ 1
Note: **: Correlation is significant at the 0.01 level (2-tailed), *: Correlation is significant at the 0.05 level (2-tailed).