
Page 142 - JOURNAL OF LIBRARY SCIENCE IN CHINA 2018 Vol. 43
P. 142
142 Journal of Library Science in China, Vol.9, 2017
literature usage counts of the four disciplines conforms to an approximate power-law distribution.
First, after ranking the articles according to the descending order of usage count, the number of
articles was divided into three equal portions. The cumulative usage count of each portion satisfies
the approximate relation of n :n:1 (as shown in Table 3). This ratio is different from Bradford’s
2
Law (the data failed to conform to Bradford’s pattern), which divides the number of pieces of
literature equally such that the number of journals satisfies 1:n:n and the divided number of pieces
2
of literature (former) is an attribute of the number of journals (latter). In contrast, in this study,
the number of pieces of literature has been divided into equal portions such that the usage count
satisfies n :n:1 and the usage count (latter) is an attribute of the number of pieces of literature
2
(former). This special law still stands regarding the component citation index distribution of
journals (Su, Yu, Xu, & Zhao, 2015), suggesting that the cumulative usage count of high-usage
count literature (Zone I) accounts for the majority of the usage count of all literature, i.e., n /(n :n:1).
2
2
According to empirical data, the n value of science and engineering is greater than that of the social
sciences whilst the n value of physics is close to 3.3. This model reflects the concentration of the
usage of academic literature, suggesting that there is a division between core and non-core zones.
This distribution law may serve as a reference model for usage count-based literature division.
Furthermore, considering that the usage data of the Web of Science can be held to be an intensive
sampling of all usage data (Inference 1-1), an attempt can be made to use the data in grading the
application of academic influence.
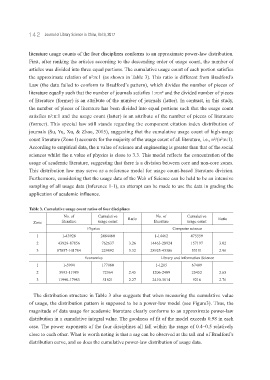
Table 3. Cumulative usage count ratios of four disciplines
No. of Cumulative Ratio No. of Cumulative Ratio
Zone literature usage count literature usage count
Physics Computer science
1 1-43928 2484460 1-14462 475559
2 43929-87856 762637 3.26 14463-28924 157197 3.02
3 87857-101784 229892 3.32 28925-43386 53151 2.96
Economics Library and Information Science
1 1-5994 177060 1-1205 67409
2 5995-11989 72364 2.45 1206-2409 25452 2.65
3 11990-17983 31821 2.27 2410-3614 9216 2.76
The distribution structure in Table 3 also suggests that when measuring the cumulative value
of usage, the distribution pattern is supposed to be a power-law model (see Figure3). Thus, the
magnitude of data usage for academic literature clearly conforms to an approximate power-law
distribution in a cumulative integral value. The goodness of fit of the model exceeds 0.98 in each
case. The power exponents of the four disciplines all fall within the range of 0.4–0.5 relatively
close to each other. What is worth noting is that a sag can be observed at the tail end of Bradford’s
distribution curve, and so does the cumulative power-law distribution of usage data.