
Page 42 - JOURNAL OF LIBRARY SCIENCE IN CHINA 2018 Vol. 43
P. 42
042 Journal of Library Science in China, Vol.9, 2017
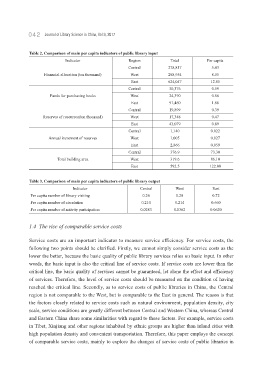
Table 2. Comparison of main per capita indicators of public library input
Indicator Region Total Per capita
Central 278,817 5.43
Financial allocation (ten thousand) West 298,954 8.05
East 624,047 12.85
Central 30,376 0.59
Funds for purchasing books West 24,390 0.66
East 91,460 1.88
Central 19,899 0.39
Reserves of resources(ten thousand) West 17,348 0.47
East 43,079 0.89
Central 1,140 0.022
Annual increment of reserves West 1,005 0.027
East 2,866 0.059
Central 376.9 73.30
Total building area West 319.6 86.10
East 592.5 122.00
Table 3. Comparison of main per capita indicators of public library output
Indicator Central West East
Per capita number of library visiting 0.26 0.28 0.72
Per capita number of circulation 0.210 0.214 0.660
Per capita number of activity participation 0.0283 0.0362 0.0620
1.4 The rise of comparable service costs
Service costs are an important indicator to measure service efficiency. For service costs, the
following two points should be clarified. Firstly, we cannot simply consider service costs as the
lower the better, because the basic quality of public library services relies on basic input. In other
words, the basic input is also the critical line of service costs. If service costs are lower than the
critical line, the basic quality of services cannot be guaranteed, let alone the effect and efficiency
of services. Therefore, the level of service costs should be measured on the condition of having
reached the critical line. Secondly, as to service costs of public libraries in China, the Central
region is not comparable to the West, but is comparable to the East in general. The reason is that
the factors closely related to service costs such as natural environment, population density, city
scale, service conditions are greatly different between Central and Western China, whereas Central
and Eastern China share some similarities with regard to those factors. For example, service costs
in Tibet, Xinjiang and other regions inhabited by ethnic groups are higher than inland cities with
high population density and convenient transportation. Therefore, this paper employs the concept
of comparable service costs, mainly to explore the changes of service costs of public libraries in