
Page 149 - JOURNAL OF LIBRARY SCIENCE IN CHINA 2018 Vol. 44
P. 149
148 Journal of Library Science in China, Vol.10, 2018
Participants (10,000 person- times) Increase Number 20.83% 7,138.15 17.80% 5,907.68 13.68% 5,014.85 7.39% 4,411.24 39.85% 4,107.67 7.18% 2,937.1 7.46% 2,740.25 -23.25% 2,550.13 24.19% 3,322.5 -2.41% 2,675.3 7.23% 2,741.5 — 2,556.6 19.44% 1.40%
Increase 22.25% 10.58% 13.18% 11.76% 19.98% 13.58% 8.88% -37.63% 4.51% 1.87% -66.26% —
Events (times) 15.46% -24.59%
Number 140,033 114,544 103,586 91,520 81,890 68,251 60,093 55,192 88,488 84,670 83,117 246,373
Borrowings (10,000 copies) Increase Number 7.52% 54,724.55 8.90% 50,895.84 14.35% 46,734.3 23.13% 40,868.32 16.66% 33,191.46 7.81% 28,451.97 2.07% 26,391.74 11.80% 25,857.28 8.49% 23,128.7 1.33% 21,318.5 3.80% 21,039.38 — 20,268.6 13.98% 5.42%
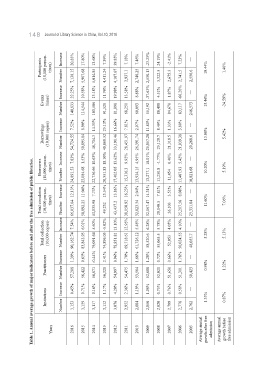
Table 1. Annual average growth of major indicators before and after the free admission of public libraries.
Borrowers (10,000 person- times) Increase Number 7.83% 24,891.53 1.53% 23,084.68 10.63% 22,736.66 18.10% 20,551.83 13.62% 17,402.05 9.92% 15,316.3 4.95% 13,934.15 18.01% 13,277.1 -1.77% 11,250.8 0.40% 11,454 5.42% 11,407.93 — 10,821.68 10.20% 5.19%
Total circulation (10,000 person- times) Increase Number 12.13% 66,037.04 11.04% 58,892.25 7.73% 53,035.98 13.34% 49,232 13.86% 43,437.2 16.23% 38,150.92 2.04% 32,823.34 14.31% 32,167.47 7.81% 28,140.5 3.51% 26,103 8.08% 25,217.56 — 23,331.84 11.60% 7.06%
Total collection (10,000 copies) Increase Number 7.54% 90,162.74 6.01% 83,843.93 5.60% 79,091.64 -5.02% 74,896.05 13.10% 78,851.81 12.95% 69,718.61 5.48% 61,726.12 6.28% 58,520.6 5.78% 55,063.5 4.05% 52,053 4.10% 50,024.55 — 48,055.7 5.28% 5.13%
Practitioners Increase Number 1.39% 57,208 0.63% 56,422 -0.44% 56,071 2.41% 56,320 0.96% 54,997 1.70% 54,475 1.66% 53,564 1.28% 52,688 0.72% 52,021 0.66% 51,650 1.76% 51,311 — 50,423 0.98% 1.22%
Institutions Increase Number 0.45% 3,153 0.71% 3,139 0.16% 3,117 1.17% 3,112 4.20% 3,076 2.36% 2,952 1.19% 2,884 1.06% 2,850 0.75% 2,820 0.76% 2,799 0.58% 2,778 — 2,762 1.33% 0.87%
Years 2016 2015 2014 2013 2012 2011 2010 2009 2008 2007 2006 2005 Average annual growth after free admission Average annual growth before free admission