
Page 123 - Journal of Library Science in China 2020 Vol.46
P. 123
122 Journal of Library Science in China, Vol.12, 2020
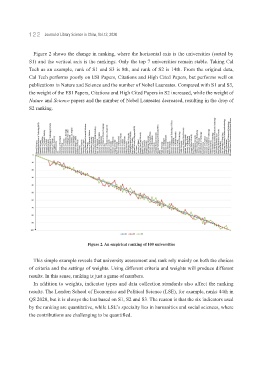
Figure 2 shows the change in ranking, where the horizontal axis is the universities (sorted by
S1) and the vertical axis is the rankings. Only the top 7 universities remain stable. Taking Cal
Tech as an example, rank of S1 and S3 is 8th, and rank of S2 is 14th. From the original data,
Cal Tech performs poorly on ESI Papers, Citations and High Cited Papers, but performs well on
publications in Nature and Science and the number of Nobel Laureates. Compared with S1 and S3,
the weight of the ESI Papers, Citations and High Cited Papers in S2 increased, while the weight of
Nature and Science papers and the number of Nobel Laureates decreased, resulting in the drop of
S2 ranking.
Figure 2. An empirical ranking of 100 universities
This simple example reveals that university assessment and rank rely mainly on both the choices
of criteria and the settings of weights. Using different criteria and weights will produce different
results. In this sense, ranking is just a game of numbers.
In addition to weights, indicator types and data collection standards also affect the ranking
results. The London School of Economics and Political Science (LSE), for example, ranks 44th in
QS 2020, but it is always the last based on S1, S2 and S3. The reason is that the six indicators used
by the ranking are quantitative, while LSE’s specialty lies in humanities and social sciences, where
the contributions are challenging to be quantified.