
Page 153 - JOURNAL OF LIBRARY SCIENCE IN CHINA 2015 Vol. 41
P. 153
152 Journal of Library Science in China, Vol. 7, 2015
3.2 Cluster analyses of students based on the motivation dimensions
The exploratory factor analysis demonstrated quite clearly that there were six distinguishable
dimensions of social reading motivation. Furthermore, paired t tests showed that students were
more motivated in some dimensions than in the others. Hence, the second goal of this study
was to examine whether there were different groups of students who had distinctively different
motivational profiles. Cluster analysis, a statistical technique that classifies individuals into
groups based on their similarity on a set of variables (D. H. Liu, N. Li, & Chao, 2008), could
help us to address this issue. The K-means cluster analysis procedure was selected rather than
the hierarchical agglomerative procedure because it deals most effectively with large data files.
But unlike hierarchical analysis, the users must specify the number of clusters to be created when
adopting K-means cluster analysis. Following what was done by Baker and Wigfield (1999), and
by Wade, Trathen, and Schraw (1990), the present study conducted several separate analyses that
specified from two to ten clusters, and then selected the most interpretable result, the one yielded
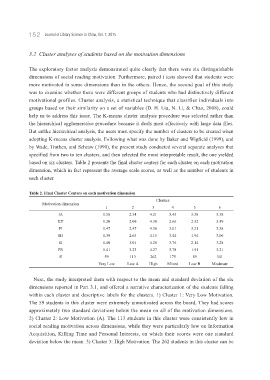
based on six clusters. Table 2 presents the final cluster centers for each cluster on each motivation
dimension, which in fact represent the average scale scores, as well as the number of students in
each cluster.
Table 2. Final Cluster Centers on each motivation dimension
Clusters
Motivation dimension
1 2 3 4 5 6
IA 1.58 2.54 4.21 3.45 3.38 3.38
KT 1.20 2.09 4.30 2.66 2.32 3.59
PI 1.47 2.47 4.36 3.01 3.21 3.38
SD 1.39 2.65 4.15 3.44 1.94 3.06
SI 1.40 3.01 4.28 3.76 2.14 3.28
PR 1.41 3.23 4.27 3.78 1.91 3.21
N 59 113 262 175 89 341
Very Low Low A High Mixed Low B Moderate
Next, the study interpreted them with respect to the mean and standard deviation of the six
dimensions reported in Part 3.1, and offered a narrative characterization of the students falling
within each cluster and descriptive labels for the clusters. 1) Cluster 1: Very Low Motivation.
The 59 students in this cluster were extremely unmotivated across the board. They had scores
approximately two standard deviations below the mean on all of the motivation dimensions.
2) Cluster 2: Low Motivation (A). The 113 students in this cluster were consistently low in
social reading motivation across dimensions, while they were particularly low on Information
Acquisition, Killing Time and Personal Interests, on which their scores were one standard
deviation below the mean. 3) Cluster 3: High Motivation. The 262 students in this cluster can be