
Page 154 - JOURNAL OF LIBRARY SCIENCE IN CHINA 2015 Vol. 41
P. 154
Wu LI / The motivation of adolescents’ social reading:A case study of middle school students’ reading via WeChat in Shanghai 153
characterized as highly motivated across dimensions. They had scores approximately one standard
deviation above the mean on all of the motivation motivations. 4) Cluster 4: Mixed Motivation.
There were 175 students in this cluster. Their scores on Information Acquisition and Self
Development were approximately equal to the mean, however, their scores on Killing Time and
Personal Interests were 1/2 standard deviation below the mean while those on Social Interaction
and Peer Recognition were 1/2 standard deviation above the mean. 5) Cluster 5: Low Motivation
(B). The 89 students in this cluster were consistently low in motivation across dimensions as
those in Cluster 2. But quite differently, they were particularly low on Self Development, Social
Interaction and Peer Recognition, on which their scores were one standard deviation below the
mean. 6) Cluster 6: Moderate Motivation. There were 341 students in this largest cluster, whose
scores on each of six motivation scale were approximately equal to the mean.
3.3 Group differences in social reading motivation
The third goal of this study was to examine whether adolescents’ overall motivation and the
dimensions varied with gender, grade and living area. A series of 2 (gender) ×2 (grade) ×2
(living area) analyses of variance were used to assess gender, grade, and living area differences
in adolescents’ social reading motivation. The analyses revealed that, 1) there were no gender
differences for overall motivation and six dimensions. 2) there were grade differences and living
area differences for overall motivation and some of the dimensions. 3) there were no interaction
effects of the three demographical variables or any two of the three. Table 3 shows the result of the
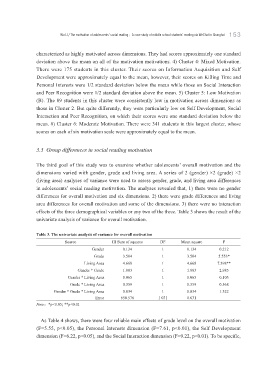
univariate analysis of variance for overall motivation.
Table 3. The univariate analysis of variance for overall motivation
Source III Sum of squares DF Mean square F
Gender 0.134 1 0.134 0.212
Grade 3.504 1 3.504 5.553*
Living Area 4.668 1 4.668 7.398**
Gender * Grade 1.883 1 1.883 2.985
Gender * Living Area 0.065 1 0.065 0.103
Grade * Living Area 0.359 1 0.359 0.568
Gender * Grade * Living Area 0.834 1 0.834 1.322
Error 650.576 1 031 0.631
Note:*p<0.05; **p<0.01
As Table 4 shows, there were four reliable main effects of grade level on the overall motivation
(F=5.55, p<0.05), the Personal Interests dimension (F=7.61, p<0.01), the Self Development
dimension (F=6.22, p<0.05), and the Social Interaction dimension (F=9.22, p<0.01). To be specific,