
Page 108 - Journal of Library Science in China, Vol.45, 2019
P. 108
CHEN Bikun, ZHOU Huixian, ZHONG Zhouyan & WANG Yuefen / Exploring the user platform preference and 107
user interest preference of Chinese scholarly articles: A comparison based on usage metrics
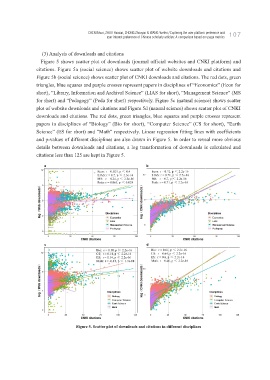
(3) Analysis of downloads and citations
Figure 5 shows scatter plot of downloads (journal official websites and CNKI platform) and
citations. Figure 5a (social science) shows scatter plot of website downloads and citations and
Figure 5b (social science) shows scatter plot of CNKI downloads and citations. The red dots, green
triangles, blue squares and purple crosses represent papers in disciplines of “Economics” (Econ for
short), “Library, Information and Archival Science” (LIAS for short), “Management Science” (MS
for short) and “Pedagogy” (Peda for short) respectively. Figure 5c (natural science) shows scatter
plot of website downloads and citations and Figure 5d (natural science) shows scatter plot of CNKI
downloads and citations. The red dots, green triangles, blue squares and purple crosses represent
papers in disciplines of “Biology” (Bio for short), “Computer Science” (CS for short), “Earth
Science” (ES for short) and “Math” respectively. Linear regression fitting lines with coefficients
and p-values of different disciplines are also drawn in Figure 5. In order to reveal more obvious
details between downloads and citations, a log transformation of downloads is calculated and
citations less than 125 are kept in Figure 5.
Figure 5. Scatter plot of downloads and citations in different disciplines