
Page 191 - JOURNAL OF LIBRARY SCIENCE IN CHINA 2015 Vol. 41
P. 191
190 Journal of Library Science in China, Vol. 7, 2015
About the diffusion stage, the curve of Business & Economics is same to the whole diffusion
curve that began to take off in 2007. Sociology started the take-off stage in 2011, while Public
Administration, Psychology and LIS still need the further data to determine whether the current
stage is on the tail of start stage or at the beginning of the take-off stage. In addition, Business &
Economics, Sociology have reached their second-order inflection points in 2010, which are same
to the whole diffusion curve. Since reaching the critical value, it can be identified that the structural
holes theory in these two areas will achieve successful spread in the future, but the diffusion curves
of the latter three disciplines have not appeared second-order inflection point yet.
According to the diffusion curves, some predictions about the diffusion of structural holes
theory in various disciplines can be made: 1) During the next few years, Sociology and Business &
Economics will produce a large number of research outcomes in their take-off stage of diffusion.
2) For disciplines at the end of the start stage, such as LIS, they will face a surge in the number
of research achievements. 3) For the disciplines that just entered start stage, such as Engineering,
Agriculture and Health as well as some of the humanity fields, it can be expected that the research
outcomes during the next few years will still be relatively rare, but it also means that high
innovative research may appear, because most innovative works of an academic innovation are
completed in the initial phase.
3.4 Main path and main path component analysis for the diffusion of structural holes
theory
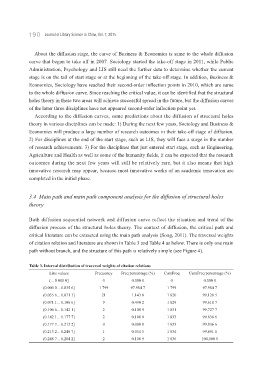
Both diffusion sequential network and diffusion curve reflect the situation and trend of the
diffusion process of the structural holes theory. The context of diffusion, the critical path and
critical literature can be extracted using the main path analysis (Song, 2011). The traversal weights
of citation relation and literature are shown in Table 3 and Table 4 as below. There is only one main
path without branch, and the structure of this path is relatively simple (see Figure 4).
Table 3. Interval distribution of traversal weights of citation relations
Line values Frequency Freq percentage (%) CumFreq CumFreq percentage (%)
(... 0.000 0] 0 0.000 0 0 0.000 0
(0.000 0... 0.035 6] 1 799 97.984 7 1 799 97.984 7
(0.035 6... 0.071 1] 21 1.143 8 1 820 99.128 5
(0.071 1... 0.106 6] 9 0.490 2 1 829 99.618 7
(0.106 6... 0.142 1] 2 0.108 9 1 831 99.727 7
(0.142 1... 0.177 7] 2 0.108 9 1 833 99.836 6
(0.177 7... 0.213 2] 0 0.000 0 1 833 99.836 6
(0.213 2... 0.248 7] 1 0.054 5 1 834 99.891 1
(0.248 7... 0.284 2] 2 0.108 9 1 836 100.000 0