
Page 119 - JOURNAL OF LIBRARY SCIENCE IN CHINA 2018 Vol. 44
P. 119
118 Journal of Library Science in China, Vol.10, 2018
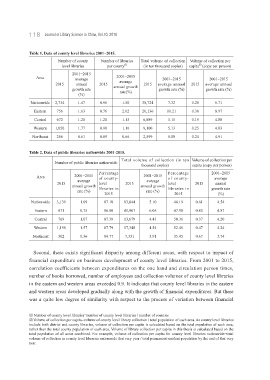
Table 1. Data of county level libraries 2001-2015. 〇a〇b
Number of county Number of libraries Total volume of collection Volume of collection per
level libraries per county ① (in ten thousand copies) capita (copy per person)
②
2001-2015
Area average 2001-2015 2001-2015 2001-2015
average
2015 annual 2015 annual growth 2015 average annual 2015 average annual
growth rate rate(%) growth rate (%) growth rate (%)
(%)
Nationwide 2,734 1.47 0.96 1.50 38,724 7.32 0.28 6.71
Eastern 756 1.63 0.76 2.02 20,136 10.21 0.38 8.97
Central 672 1.20 1.20 1.15 6,889 5.11 0.19 4.88
Western 1,050 1.77 0.90 1.16 9,100 5.13 0.25 4.83
Northeast 256 0.61 0.89 0.66 2,599 5.08 0.24 4.91
Table 2. Data of public libraries nationwide 2001-2015.
Total volume of collection (in ten Volume of collection per
Number of public libraries nationwide
thousand copies) capita (copy per person)
Percentage Percentage 2001-2015
Area 2001-2015 of county- 2001-2015 of county- average
2015 average level 2015 average level 2015 annual
annual growth libraries in annual growth libraries in growth rate
rate (%) rate (%)
2015 2015 (%)
Nationwide 3,139 1.09 87.10 83,844 5.10 46.19 0.61 4.54
Eastern 871 0.75 86.80 41,967 6.05 47.98 0.80 4.87
Central 769 1.07 87.39 13,679 4.43 50.36 0.37 4.20
Western 1,196 1.57 87.79 17,348 4.54 52.46 0.47 4.24
Northeast 302 0.36 84.77 7,331 3.91 35.45 0.67 3.74
Second, there exists significant disparity among different areas, with respect to impact of
financial expenditure on business development of county level libraries. From 2001 to 2015,
correlation coefficients between expenditures on the one hand and circulation person times,
number of books borrowed, number of employees and collection volumes of county level libraries
in the eastern and western areas exceeded 0.9. It indicates that county level libraries in the eastern
and western areas developed gradually along with the growth of financial expenditures. But there
was a quite low degree of similarity with respect to the process of variation between financial
① Number of county level libraries=number of county level libraries / number of counties
②Volume of collection per capita=volume of county level library collection / total population of each area. As county level libraries
include both district and county libraries, volume of collection per capita is calculated based on the total population of each area,
rather than the total county population of each area. Volume of library collection per capita in this thesis is calculated based on the
total population of all areas combined. For example, volume of collection per capita for county level libraries nationwide=total
volume of collection in county level libraries nationwide that very year / total permanent resident population by the end of that very
year.