
Page 120 - JOURNAL OF LIBRARY SCIENCE IN CHINA 2018 Vol. 44
P. 120
FU Caiwu & YUE Nan / Restrictions on incremental financial investment in the construction of 119
modern public cultural service system: Based on investigations of county public libraries
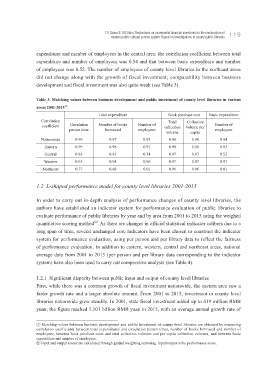
expenditure and number of employees in the central area: the correlation coefficient between total
expenditure and number of employees was 0.54 and that between basic expenditure and number
of employees was 0.52. The number of employees of county level libraries in the northeast areas
did not change along with the growth of fiscal investment; comparability between business
development and fiscal investment was also quite weak (see Table 3).
Table 3. Matching values between business development and public investment of county level libraries in various
areas 2001-2015 .
〇a ①
Total expenditure Book purchase cost Basic expenditure
Correlation Total Collection
coefficient Circulation Number of books Number of collection volume per Number of
person time borrowed employees employees
volume capita
Nationwide 0.99 0.97 0.93 0.98 0.98 0.94
Eastern 0.99 0.98 0.91 0.98 0.98 0.93
Central 0.93 0.85 0.54 0.97 0.97 0.52
Western 0.95 0.94 0.96 0.97 0.97 0.97
Northeast 0.77 0.68 0.01 0.96 0.96 0.01
1.2 L-shaped performance model for county level libraries 2001-2015
In order to carry out in-depth analysis of performance changes of county level libraries, the
authors have established an indicator system for performance evaluation of public libraries to
evaluate performance of public libraries by year and by area from 2001 to 2015 using the weighed
quantitative scoring method . As there are changes in official statistical indicator calibers due to a
〇b ②
long span of time, several unchanged core indicators have been chosen to construct the indicator
system for performance evaluation, using per person and per library data to reflect the fairness
of performance evaluation. In addition to eastern, western, central and northeast areas, national
average data from 2001 to 2015 (per person and per library data corresponding to the indicator
system) have also been used to carry out comparative analysis (see Table 4).
1.2.1 Significant disparity between public input and output of county level libraries
First, while there was a common growth of fiscal investment nationwide, the eastern area saw a
faster growth rate and a larger absolute amount. From 2001 to 2015, investment in county level
libraries nationwide grew steadily. In 2001, state fiscal investment added up to 419 million RMB
yuan; the figure reached 5.101 billion RMB yuan in 2015, with an average annual growth rate of
① Matching values between business development and public investment of county level libraries are obtained by measuring
correlation coefficients between total expenditures and circulation person times, number of books borrowed and number of
employees, between book purchase costs and total collection volumes and per capita collection volumes, and between basic
expenditure and number of employees.
② Input and output scores are calculated through graded weighting summing. Input/output is the performance score.