
Page 122 - JOURNAL OF LIBRARY SCIENCE IN CHINA 2018 Vol. 44
P. 122
FU Caiwu & YUE Nan / Restrictions on incremental financial investment in the construction of 121
modern public cultural service system: Based on investigations of county public libraries
by attracting as many as possible readers to visit and use libraries. The performance of public
libraries is therefore evaluated on the basis of the number of circulation person times and social
and educational events. To be specific, three indicators have been designed, including number of
visits to public libraries per hundred persons, number of events organized per library, and number
of participants in events organized per library.
In order to facilitate technical analysis, it is necessary to carry out standard treatment of indicator
data of county level libraries by year and by area from 2001 to 2015 and adopt the weighed
quantitative scoring method to measure performance on the basis of standardizing indicator data
and then calculating input and output scores through graded weighing summing. Indicator data of
county level libraries in the eastern area in 2015 were adopted as the base to standardize indicator
data of county level libraries in the four major areas and throughout the whole country from 2001
to 2015. By using the above-mentioned scoring method, performance of county level libraries in
the above areas and nationwide was measured and produced.
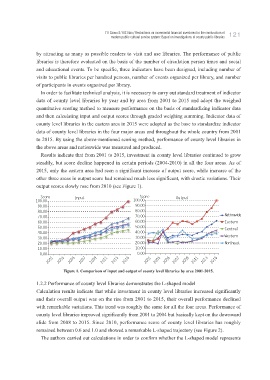
Results indicate that from 2001 to 2015, investment in county level libraries continued to grow
steadily, but score decline happened in certain periods (2004-2010) in all the four areas. As of
2015, only the eastern area had seen a significant increase of output score, while increase of the
other three areas in output score had remained much less significant, with drastic variations. Their
output scores slowly rose from 2010 (see Figure 1).
4DPSF *OQVU 4DPSF 0VUQVU
/BUJPOXJEF
&BTUFSO
$FOUSBM
8FTUFSO
/PSUIFBTU
Figure 1. Comparison of input and output of county level libraries by area 2001-2015.
1.2.2 Performance of county level libraries demonstrates the L-shaped model
Calculation results indicate that while investment in county level libraries increased significantly
and their overall output was on the rise from 2001 to 2015, their overall performance declined
with remarkable variations. This trend was roughly the same for all the four areas. Performance of
county level libraries improved significantly from 2001 to 2004 but basically kept on the downward
slide from 2008 to 2015. Since 2010, performance score of county level libraries has roughly
remained between 0.6 and 1.0 and showed a remarkable L-shaped trajectory (see Figure 2).
The authors carried out calculations in order to confirm whether the L-shaped model represents