
Page 105 - Journal of Library Science in China 2020 Vol.46
P. 105
104 Journal of Library Science in China, Vol.12, 2020
The objective function of optimal scale regression is , where are the index values of independent
variables, and θ and φ are nonlinear functions to quantify categorical variables. The essence of this
regression is to achieve the maximum correlation between and by a feasible nonlinear function.
Since this method can quantify the original categorical variables through nonlinear changes to
perform regression analysis, it is more widely used in regression analysis containing categorical
variables. For example, the study of the relationship between objective water quality indicators
and the subjective assessment of waterfront tourists by Steinwebder Gundacker, and Wittman
(2008), the study of public housing satisfaction in cities by Ibem and Dolapo (2013), the study of
the relationship between the degree of transfer of surplus agricultural labour and its land disposal
method by W.W. ZHANG, F.M. ZHANG, & X.C. YANG (2009), and the study led by Zhang
Ziqiong et al. about the influence of tourism motivation and demographic characteristics on Hong
Kong residents’ tourism behaviour (Z. Q. ZHANG, LAW, & T. LIU, 2012), and so on.
The significance of the ANOVA results of different items was less than 0.001 by processing the
categorical regression analysis of CBP, respectively. The number indicated that the established
regression models of different CBP were feasible. The categorical regression coefficients and
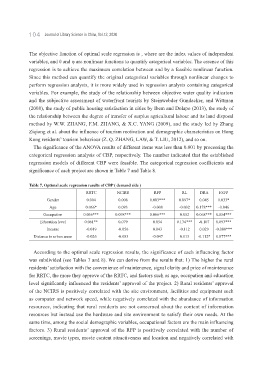
significance of each project are shown in Table 7 and Table 8.
Table 7. Optimal scale regression results of CBP ( demand side )
RRTC NCIRS RFP RL DRA FSFP
Gender 0.004 0.008 0.003*** 0.097* 0.045 0.033*
Age 0.066* 0.093 -0.008 -0.032 0.178*** -0.046
Occupation 0.056*** 0.098*** 0.066*** 0.052 0.068*** 0.054***
Education level 0.061** 0.079 0.054 0.134*** -0.107 0.093***
Income -0.019 -0.056 0.043 -0.112 0.029 -0.088***
Distance to urban areas -0.026 -0.083 -0.047 0.013 -0.112* 0.077***
According to the optimal scale regression results, the significance of each influencing factor
was subdivided (see Tables 7 and 8). We can derive from the results that: 1) The higher the rural
residents’ satisfaction with the convenience of maintenance, signal clarity and price of maintenance
for RRTC, the more they approve of the RRTC, and factors such as age, occupation and education
level significantly influenced the residents’ approval of the project. 2) Rural residents’ approval
of the NCIRS is positively correlated with the site environment, facilities and equipment such
as computer and network speed, while negatively correlated with the abundance of information
resources, indicating that rural residents are not concerned about the content of information
resources but instead use the hardware and site environment to satisfy their own needs. At the
same time, among the social demographic variables, occupational factors are the main influencing
factors. 3) Rural residents’ approval of the RFP is positively correlated with the number of
screenings, movie types, movie content attractiveness and location and negatively correlated with