
Page 135 - JOURNAL OF LIBRARY SCIENCE IN CHINA 2015 Vol. 41
P. 135
134 Journal of Library Science in China, Vol. 7, 2015
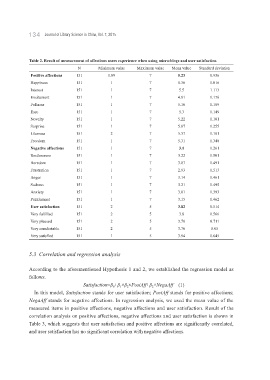
Table 2. Result of measurement of affections users experience when using micro-blogs and user satisfaction
N Minimum value Maximum value Mean value Standard deviation
Positive affections 151 1.89 7 5.23 0.936
Happiness 151 1 7 5.36 1.016
Interest 151 1 7 5.5 1.113
Excitement 151 1 7 4.81 1.176
Fullness 151 1 7 5.16 1.189
Ease 151 1 7 5.3 1.149
Novelty 151 1 7 5.22 1.101
Surprise 151 1 7 5.07 1.255
Likeness 151 2 7 5.37 1.181
Freedom 151 1 7 5.31 1.348
Negative affections 151 1 7 3.1 1.261
Restlessness 151 1 7 3.22 1.501
Boredom 151 1 7 3.07 1.491
Frustration 151 1 7 2.93 1.513
Anger 151 1 7 3.14 1.461
Sadness 151 1 7 3.21 1.495
Anxiety 151 1 7 3.01 1.393
Puzzlement 151 1 7 3.15 1.462
User satisfaction 151 2 5 3.82 0.514
Very fulfilled 151 2 5 3.8 0.566
Very pleased 151 2 5 3.78 0.711
Very comfortable 151 2 5 3.76 0.65
Very satisfied 151 1 5 3.94 0.645
5.3 Correlation and regression analysis
According to the aforementioned Hypothesis 1 and 2, we established the regression model as
follows.
Satisfaction=β 0 +β 1 ×β 2 ×PosiAff+β 2 ×NegaAff (1)
In this model, Satisfaction stands for user satisfaction; PosiAff stands for positive affections;
NegaAff stands for negative affections. In regression analysis, we used the mean value of the
measured items in positive affections, negative affections and user satisfaction. Result of the
correlation analysis on positive affections, negative affections and user satisfaction is shown in
Table 3, which suggests that user satisfaction and positive affections are significantly correlated,
and user satisfaction has no significant correlation with negative affections.