
Page 138 - JOURNAL OF LIBRARY SCIENCE IN CHINA 2015 Vol. 41
P. 138
Luchuan LIU & Kai SUN / Analysis of the relationship between microblogging users’ affections and users’ satisfaction 137
5.4 Adjusted variables’ effects on satisfaction and affections
According to the aforementioned Hypothesis 3, 4 and 5, we use the equation (3) to verify
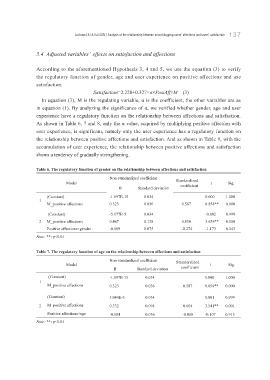
the regulatory function of gender, age and user experience on positive affections and use
satisfaction.
Satisfaction=2.228+0.327×α×PosiAff×M (3)
In equation (3), M is the regulating variable, α is the coefficient, the other variables are as
in equation (1). By analyzing the significance of α, we verified whether gender, age and user
experience have a regulatory function on the relationship between affections and satisfaction.
As shown in Table 6, 7 and 8, only the α value, acquired by multiplying positive affection with
user experience, is significant, namely only the user experience has a regulatory function on
the relationship between positive affections and satisfaction. And as shown in Table 9, with the
accumulation of user experience, the relationship between positive affections and satisfaction
shows a tendency of gradually strengthening.
Table 6. The regulatory function of gender on the relationship between affections and satisfaction
Non-standardized coefficient Standardized
Model coefficient t Sig.
B Standard deviation
(Constant) -1.097E-15 0.034 0.000 1.000
1
M_positive affections 0.323 0.036 0.587 8.854** 0.000
(Constant) -5.177E-5 0.034 -0.002 0.999
2 M_positive affections 0.467 0.128 0.850 3.638** 0.000
Positive affections×gender -0.089 0.075 -0.274 -1.173 0.243
Note: **: p<0.01
Table 7. The regulatory function of age on the relationship between affections and satisfaction
Non-standardized coefficient Standardized
Model t Sig.
B Standard deviation coefficient
(Constant) -1.097E-15 0.034 0.000 1.000
1
M_positive affections 0.323 0.036 0.587 8.854** 0.000
(Constant) 3.084E-5 0.034 0.001 0.999
2 M_positive affections 0.332 0.094 0.604 3.541** 0.001
Positive affections×age -0.004 0.036 -0.018 -0.107 0.915
Note: **: p<0.01