
Page 136 - JOURNAL OF LIBRARY SCIENCE IN CHINA 2015 Vol. 41
P. 136
Luchuan LIU & Kai SUN / Analysis of the relationship between microblogging users’ affections and users’ satisfaction 135
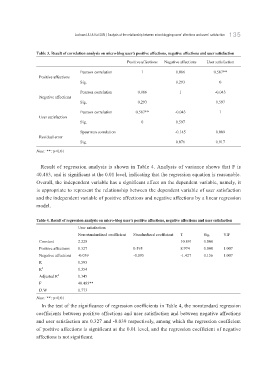
Table 3. Result of correlation analysis on micro-blog user’s positive affections, negative affections and user satisfaction
Positive affections Negative affections User satisfaction
Pearson correlation 1 0.086 0.587**
Positive affections
Sig. 0.293 0
Pearson correlation 0.086 1 -0.043
Negative affections
Sig. 0.293 0.597
Pearson correlation 0.587** -0.043 1
User satisfaction
Sig. 0 0.597
Spearman correlation -0.145 0.009
Residual error
Sig. 0.076 0.917
Note: **: p<0.01
Result of regression analysis is shown in Table 4. Analysis of variance shows that F is
40.483, and is significant at the 0.01 level, indicating that the regression equation is reasonable.
Overall, the independent variable has a significant effect on the dependent variable, namely, it
is appropriate to represent the relationship between the dependent variable of user satisfaction
and the independent variable of positive affections and negative affections by a linear regression
model.
Table 4. Result of regression analysis on micro-blog user’s positive affections, negative affections and user satisfaction
User satisfaction
Non-standardized coefficient Standardized coefficient T Sig. VIF
Constant 2.228 10.891 0.000
Positive affections 0.327 0.595 8.974 0.000 1.007
Negative affections -0.039 -0.095 -1.427 0.156 1.007
R 0.595
R 2 0.354
Adjusted R 2 0.345
F 40.483**
D.W 1.773
Note: **: p<0.01
In the test of the significance of regression coefficients in Table 4, the nonstandard regression
coefficients between positive affections and user satisfaction and between negative affections
and user satisfaction are 0.327 and -0.039 respectively, among which the regression coefficient
of positive affections is significant at the 0.01 level, and the regression coefficient of negative
affections is not significant.