
Page 137 - JOURNAL OF LIBRARY SCIENCE IN CHINA 2015 Vol. 41
P. 137
136 Journal of Library Science in China, Vol. 7, 2015
When establishing the regression model of practical problems, it is often contrary to
the regression hypothesis. Thus, it also needs to check whether there is heteroscedasticity,
autocorrelation and multicollinearity. Heteroscedasticity is checked by the method of calculating
the Spearman correlation coefficient of residual errors and independent variables (He, 2007).
Table 3 shows that the Spearman correlation values of residual error value and positive affections
as well as residual error value and negative affections are -0.145 and 0.009 respectively, and the
significance levels at 0.05 and 0.01 are low. Thus it is considered that the residual error value
is not related to the independent variable of positive and negative affections, that is, there is no
heteroscedasticity. Autocorrelation is checked by the method of D. W value. It is generally believed
that when the D.W value is at around 2, it is safe to think the model does not have autocorrelation
of sequence (He, 2007). As shown in Table 4, the D.W value is 1.773, and is about 2. Thus there
is no autocorrelation. Multicollinearity is checked by the method of variance inflation factor
(VIF). When the VIF value is much greater than 1, it means that there is a serious multicollinearity
problem (He, 2007). As shown in Table 4, the VIF values of positive affections and negative
affections are 1.007, very close to 1. Moreover, the simple correlation coefficient between positive
affections and negative affections is not significant (see Table 4). Thus the model does not have
multicollinearity problem.
Satisfaction=2.228+0.327×0.327×PosiAff (2)
Equation (2) is the linear regression model.
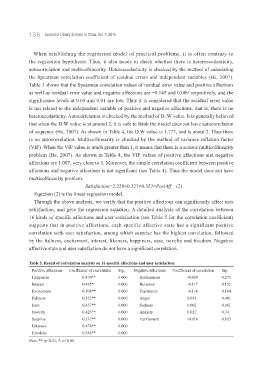
Through the above analysis, we verify that the positive affections can significantly affect user
satisfaction, and give the regression equation. A detailed analysis of the correlation between
16 kinds of specific affections and user satisfaction (see Table 5 for the correlation coefficient)
suggests that in positive affections, each specific affective state has a significant positive
correlation with user satisfaction, among which surprise has the highest correlation, followed
by the fullness, excitement, interest, likeness, happiness, ease, novelty and freedom. Negative
affective state and user satisfaction do not have a significant correlation.
Table 5. Result of correlation analysis on 16 specific affections and user satisfaction
Positive affections Coefficient of correlation Sig. Negative affections Coefficient of correlation Sig.
Happiness 0.470** 0.000 Restlessness -0.089 0.275
Interest 0.485* 0.000 Boredom -0.117 0.152
Excitement 0.508** 0.000 Frustration -0.114 0.164
Fullness 0.532** 0.000 Anger 0.058 0.481
Ease 0.457** 0.000 Sadness 0.002 0.981
Novelty 0.423** 0.000 Anxiety 0.027 0.74
Surprise 0.537** 0.000 Puzzlement -0.018 0.823
Likeness 0.478** 0.000
Freedom 0.348** 0.000
Note:**: p<0.01, *: p<0.05