
Page 171 - JOURNAL OF LIBRARY SCIENCE IN CHINA 2018 Vol. 42
P. 171
170 Journal of Library Science in China, Vol. 8, 2016
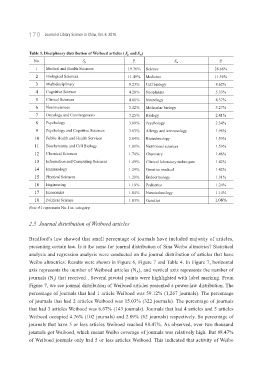
Table 3. Disciplinary distribution of Weiboed articles ( S p and S m )
No. S p P. S m P.
1 Medical and Health Sciences 19.76% Science 28.68%
2 Biological Sciences 11.49% Medicine 11.36%
3 Multidisciplinary 9.23% Cell biology 8.62%
4 Cognitive Science 4.28% Neoplasms 5.33%
5 Clinical Sciences 4.01% Neurology 4.37%
6 Neurosciences 3.42% Molecular biology 3.27%
7 Oncology and Carcinogenesis 3.25% Biology 2.41%
8 Psychology 3.09% Psychology 2.34%
9 Psychology and Cognitive Sciences 3.03% Allergy and immunology 1.98%
10 Public Health and Health Services 2.04% Biotechnology 1.59%
11 Biochemistry and Cell Biology 1.81% Nutritional sciences 1.59%
12 Chemical Sciences 1.74% Chemistry 1.48%
13 Information and Computing Sciences 1.49% Clinical laboratory techniques 1.42%
14 Immunology 1.24% Genetics medical 1.42%
15 Physical Sciences 1.20% Endocrinology 1.31%
16 Engineering 1.19% Pediatrics 1.24%
17 Economics 1.04% Nanotechnology 1.14%
18 Political Science 1.03% Genetics 1.08%
Note:#1 represents No.1 in category.
2.5 Journal distribution of Weiboed articles
Bradford’s law showed that small percentage of journals have included majority of articles,
presenting certain law. Is it the same for journal distribution of Sina Weibo altmetrics? Statistical
analysis and regression analysis were conducted on the journal distribution of articles that have
Weibo altmetrics. Results were shown in Figure 6, Figure 7 and Table 4. In Figure 7, horizontal
axis represents the number of Weiboed articles (N A ), and vertical axis represents the number of
journals (N j ) that received . Several pivotal points were highlighted with label marking. From
Figure 7, we see journal distribution of Weiboed articles presented a power-law distribution. The
percentage of journals that had 1 article Weiboed was 59.12% (1,267 journals). The percentage
of journals that had 2 articles Weiboed was 15.03% (322 journals). The percentage of journals
that had 3 articles Weiboed was 6.67% (143 journals). Journals that had 4 articles and 5 articles
Weiboed occupied 4.76% (102 journals) and 2.89% (62 journals) respectively. So percentage of
journals that have 5 or less articles Weiboed reached 88.47%. As observed, over two thousand
journals got Weiboed, which meant Weibo coverage of journals was relatively high. But 88.47%
of Weiboed journals only had 5 or less articles Weiboed. This indicated that activity of Weibo