
Page 92 - Journal of Library Science in China, Vol.45, 2019
P. 92
LI Guihua & LIU Jing / Transition: Adolescents’ hybrid reading in the omnimedia era 091
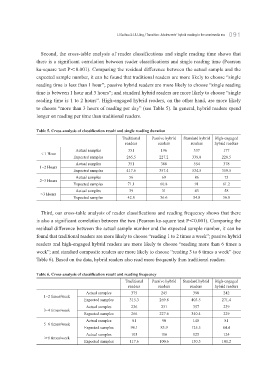
Second, the cross-table analysis of reader classifications and single reading time shows that
there is a significant correlation between reader classifications and single reading time (Pearson
ka-square test P<0.001). Comparing the residual difference between the actual sample and the
expected sample number, it can be found that traditional readers are more likely to choose “single
reading time is less than 1 hour”; passive hybrid readers are more likely to choose “single reading
time is between 1 hour and 3 hours”; and standard hybrid readers are more likely to choose “single
reading time is 1 to 2 hours”. High-engaged hybrid readers, on the other hand, are more likely
to choose “more than 3 hours of reading per day” (see Table 5). In general, hybrid readers spend
longer on reading per time than traditional readers.
Table 5. Cross-analysis of classification result and single reading duration
Traditional Passive hybrid Standard hybrid High-engaged
readers readers readers hybrid readers
Actual samples 351 196 337 177
< 1 Hour
Expected samples 265.5 227.2 339.8 228.5
Actual samples 351 386 554 378
1-2 Hours
Expected samples 417.6 357.4 534.5 359.5
Actual samples 56 69 86 73
2-3 Hours
Expected samples 71.1 60.8 91 61.2
Actual samples 39 31 43 58
>3 Hours
Expected samples 42.8 36.6 54.8 36.8
Third, our cross-table analysis of reader classifications and reading frequency shows that there
is also a significant correlation between the two (Pearson ka-square test P<0.001). Comparing the
residual difference between the actual sample number and the expected sample number, it can be
found that traditional readers are more likely to choose “reading 1 to 2 times a week”; passive hybrid
readers and high-engaged hybrid readers are more likely to choose “reading more than 6 times a
week”; and standard composite readers are more likely to choose “reading 3 to 6 times a week” (see
Table 6). Based on the data, hybrid readers also read more frequently than traditional readers.
Table 6. Cross-analysis of classification result and reading frequency
Traditional Passive hybrid Standard hybrid High-engaged
readers readers readers hybrid readers
Actual samples 375 245 398 242
1-2 times/week
Expected samples 315.3 269.8 403.5 271.4
Actual samples 236 231 357 239
3-4 times/week
Expected samples 266 227.6 340.4 229
Actual samples 81 90 140 81
5-6 times/week
Expected samples 98.1 83.9 125.5 84.4
Actual samples 105 116 125 124
>6 times/week
Expected samples 117.6 100.6 150.5 101.2